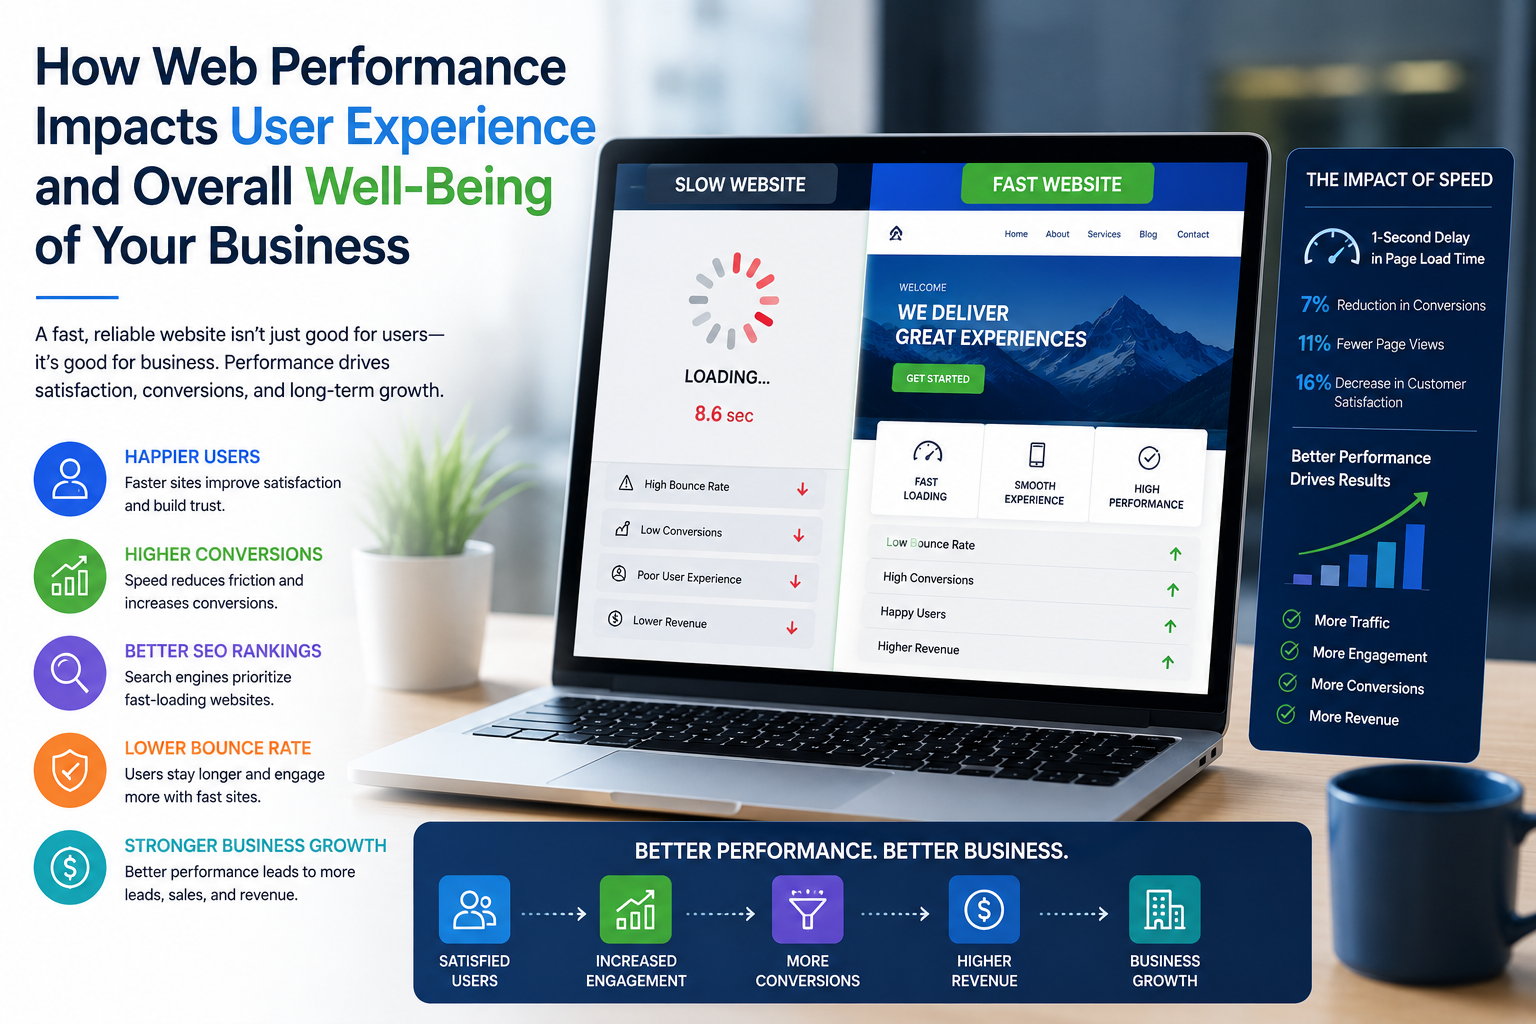
How Web Performance Impacts User Experience and overall well being of your business
A 100-millisecond delay in load time costs a retailer 7% of conversion. A two-second delay doubles bounce rate. A three-second mobile load time loses 53% of visitors before content renders. These numbers came from large-scale studies across 10 billion user visits and 11 million mobile pages. They explain why fast sites compound into business strength while slow sites quietly erode every metric the operator cares about. The health of an online business sits on top of how its pages perform under real conditions. When pages load fast, customers stay, return, and tell others. When pages load slowly, the customer base shrinks one missed sale at a time. The connection between web performance and business outcomes is direct and measurable, and the data shows the gap between fast and slow sites widens every year.
Speed as Revenue
The Akamai retail performance study documented that a 100ms delay in load time correlates with a 7% drop in conversion rate. Pages that loaded in 2.7 seconds peaked at 12.8% conversion. Pages that loaded in 2.8 seconds dropped to 12.5%. The math compounds across millions of visitors. A site doing $5 million in annual revenue loses roughly $35,000 for every 100ms slower it gets. A site doing $50 million loses $350,000.
The reverse holds true. Sites that improve load time from 4 seconds to 2 seconds typically see conversion lifts between 15% and 35%. The gain has nothing to do with new marketing copy. It comes from how many people stay long enough to buy.
Bounce and Conversion Mechanics
53% of mobile users abandon a page that takes longer than 3 seconds to load. 73% of consumers say they will switch to an alternative site or app if a mobile page is too slow. These numbers come from observed behavior in monitored sessions across millions of real visits.
The mechanism is straightforward. Tolerance for waiting on a screen is roughly one second for free interaction, three seconds before frustration sets in, and ten seconds before the user concludes the site is broken. Website response times research from Nielsen Norman Group fixed these thresholds decades ago. They have not changed because human attention spans have not changed. What has changed is how many alternatives the user has within one tap.
The Mobile Reality
Mobile commerce is projected to account for 59% of total retail e-commerce sales in 2025, roughly $4 trillion globally. The U.S. m-commerce share of retail sales crossed 60% of e-commerce traffic on Thanksgiving 2025 for the first time. The traffic mix has tipped toward mobile permanently.
The mobile reality changes performance economics. The average mobile page takes 8.6 seconds to load, well above the 2.5-second threshold Google sets in Core Web Vitals. As load time goes from one second to 10 seconds, mobile bounce probability rises 123%. When the page exceeds 4MB in resources, conversion probability drops 95% as element count climbs. New industry benchmarks for mobile page speed from Google found 53% of pages were over 2MB in size, and many site owners had no idea their builds had grown that heavy.
Performance Foundation
Performance starts at the host. A storefront on a slow server cannot be optimized with image compression or caching plugins alone. The bottleneck is the time before the browser receives the first byte. Server response time below 200ms gives the rest of the page a fair chance.
Operators who want measurable performance tend to invest in fast website hosting with managed caching, isolated resources, and CDN delivery on the same plan. The hosting layer determines what the application can ever achieve.
Customer Retention and Lifetime Value
The harder cost is what happens after the first slow visit. 88% of online consumers are less likely to return to a site after a bad first visit. Slow-loading websites collectively cost businesses an estimated $2 billion in lost revenue annually.
Retention math compounds against slow sites. Increasing customer retention by 5% can lift profitability by 25% to 95% across industries, according to research by Frederick Reichheld of Bain & Company. The first slow page visit eliminates that retention possibility before the relationship begins. A returning customer base is the cheapest form of growth, and slow sites prevent that base from forming.
The lifetime value math also tilts. A customer who waited 1 second for a page renders three to four return visits in the first year. A customer who waited 5 seconds renders one or none. The acquisition cost is the same. The return on the cost is not.
Search Visibility and Performance
Google has measured page speed as a ranking signal since 2014, and Core Web Vitals codified the measurement in 2021. Pages that pass all three Core Web Vitals thresholds receive a small but real ranking advantage. Pages that miss the thresholds compound the loss across organic search.
The 23% additional traffic loss observed for sites with LCP slower than 3 seconds after the December 2025 core update made the cost direct. Search traffic for slow sites declines while content quality stays the same, because Google’s ranking system now treats speed as part of how it evaluates the page. The result is a feedback loop. A slow site loses traffic; fewer visits mean less behavioral signal, which in turn lowers ranking further. Speed protects rankings from this spiral.
What to Track Each Month
The monthly metric review for any site should include four numbers. The first is LCP at the 75th percentile of mobile traffic. The second is bounce rate broken out by page load bucket (under 2s, 2-4s, over 4s). The third is the conversion rate by load time bucket. The fourth is the search ranking position for the top 20 pages, plotted against the LCP for those same pages.
These four numbers turn web performance from an engineering problem into a business problem. Operators who track them catch trouble before it becomes lost revenue. Skipping the review means catching the problem months later, after traffic has declined and the cause is no longer obvious. Performance is the input. Customer retention, conversion, and ranking are the outputs that follow.

Stay updated with our latest publications.
Discover Issues
See how we can help you grow in the online space!
Advertise With Us
We can help promote your business.
Find Out More